Three Ways Evaluation Dashboards Can Amplify Your Impact
Creating effective evaluation dashboards can increase learning, enhance communication, and improve decision making.
Evaluation is most beneficial when it’s used as an ongoing tool for learning and communication, rather than an occasional endeavor undertaken only for significant decision making. In this light, well-designed dashboards—akin to the ones you probably see on your phone or your computer these days—can be powerful evaluative tools that allow for continual awareness, immediate insight, clearer communication, and, ultimately, better decision making about future investments. Here’s how.
Dashboards help you learn: they enable continual awareness and immediate insight into the ongoing impact of your grant making. When built well, they seamlessly bring together the information you need in order to communicate effectively and make better decisions. Dashboards can include both quantitative and qualitative information collected by you, your grantees, or secondary sources. Whether you need to assess how public data, patient records, or student performance indicators interact with what you know about your grants, a dashboard can help combine disparate data sources into accessible, illuminating visual representations. For example, a funder can use community-based data, such as school district test scores, to examine the year-over-year effects of early childhood interventions, then easily provide this information to its board to inform future grant making.
Dashboards can also help funders learn about and improve their processes. They provide an opportunity to assess both your data’s quality and your capacity for using it effectively. In the process of implementing a dashboard, you may determine that you should be collecting additional or different kinds of data—and dashboards can and should change as you refine and enhance your grant-making strategies. As the information you collect improves, you position yourself for more effective grant making.
Dashboards help you communicate: they enable stakeholders such as board members, organizational partners, and grantees to see the impact of your grants. Foundations have many stakeholders, all of whom are interested in seeing evidence of impact. Dashboards can help show it. For example, we work with a place-based conservation funder that draws on its dashboard to report progress against its goals to a variety of stakeholder populations. The dashboard data feed directly into its annual report. The foundation also posts data to its website to communicate overall progress to the local community, to current and potential grantees, and to funding partners. Finally, it shares the data annually with steering committee members to spark conversation about both the impact of grants and about whether the measurement approaches adequately capture outcomes. This direct means of sharing data helps everyone stay on the same page and move in the same direction. Dashboards can also demonstrate where change has been slow and whether greater resources would expedite change.
Dashboards improve decision making: because they enable deeper understanding and better communication, they better position decision makers to drive increased impact. In short, dashboards make for smarter grant making. The process of building a dashboard engages you in translating your strategies into short-, medium-, and long-term outcomes. Once these are built into a dashboard, you can regularly track progress against outcomes and, based on trends you see, make decisions about your strategy and grant making moving forward. Obviously, dashboards shouldn’t be the only basis for important decisions, but they provide an effective starting point for conversations that steer you toward the best possible courses of action.
Of course, all of this presumes that the dashboard you develop gathers and represents the right data to help you answer your questions in the right way. Our team is happy to help with this challenge. We work closely with clients to identify and refine the questions they seek to answer through their dashboards and collaborate with stakeholders to determine which indicators to use and how best to measure them. Only after a thorough process do we build your dashboard, with the aim of providing rich and ready accounts of progress toward goals.
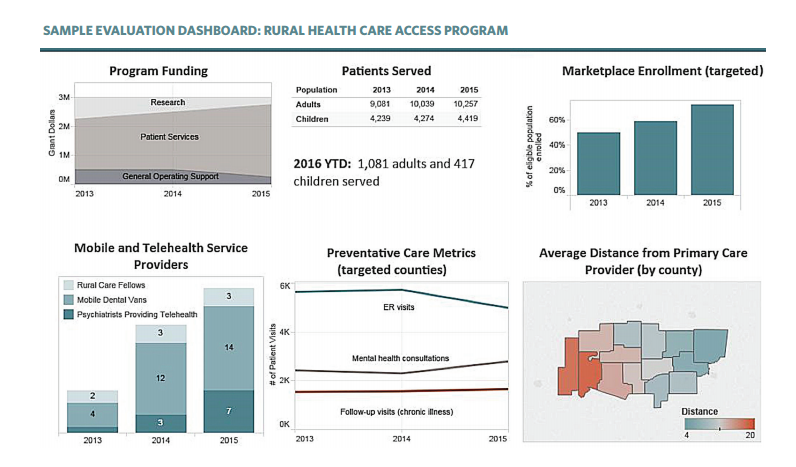
While we can’t share an actual dashboard without compromising client confidentiality, we’ve designed a sample dashboard (pictured above) that demonstrates some of the look, feel, and functionality of the tools we’ve created for Arabella clients. Click here to download the document that contains it. If you have any questions about how to use evaluation dashboards to enhance your impact, please email us.
*
Julie Slay leads Arabella’s evaluation practice, employing a range of methodologies and tools to help clients understand the effectiveness of their grants and other investments—and ultimately determine how they can best use their resources to achieve the outcomes they seek. She directs teams using both qualitative and quantitative evaluation approaches to conduct developmental, formative, and retrospective evaluations, as well as to develop evaluation frameworks, tools, and instruments that enable ongoing learning, effective monitoring, and practical program management.
Marissa Guerrero is an associate director at Arabella, where she manages projects and advises clients on strategy development, evaluation, and project implementation. Marissa has expertise in evaluation design and implementation, including survey design, interviews, quantitative and qualitative data analysis, and domestic site visits. She is currently conducting an evaluation of a national effort to ensure that all children have an opportunity to learn in a safe and supportive environment.

